


FinData Explorer: A Step-by-Step Tutorial Using BeautifulSoup, yfinance, matplotlib, ipywidgets, and fpdf for Financial Data Extraction, Interactive Visualization, and Dynamic PDF Report Generation
www.marktechpost.com
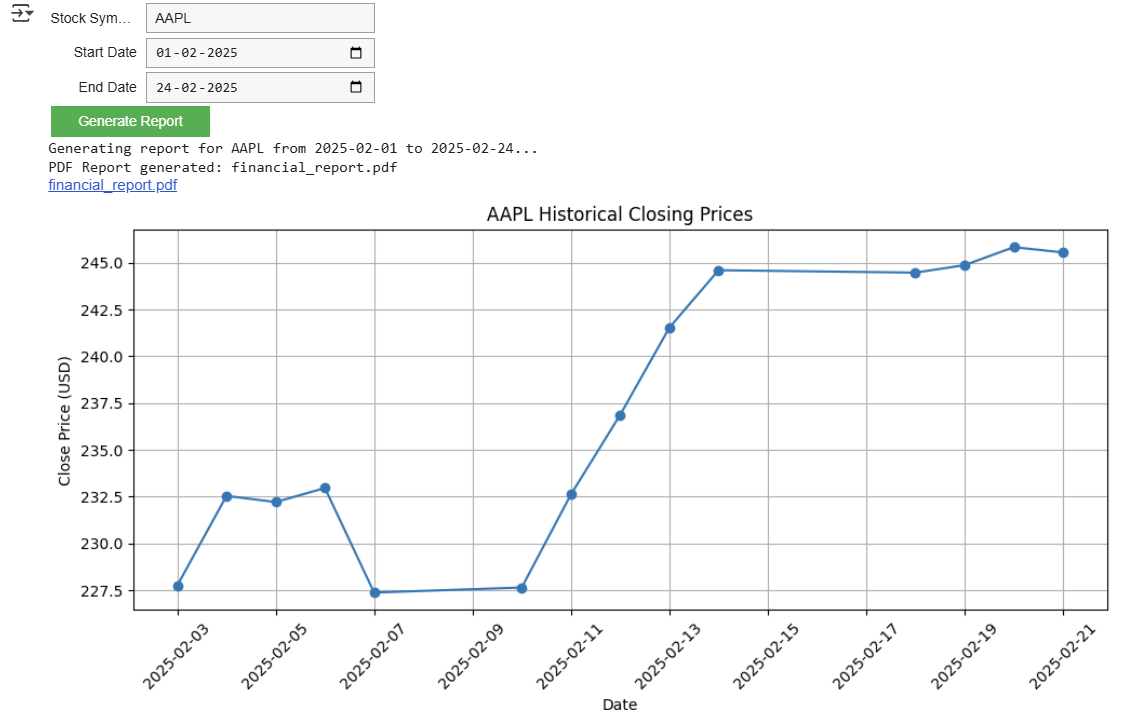
In this tutorial, we will guide you through building an advanced financial data reporting tool on Google Colab by combining multiple Python libraries. Youll learn how to scrape live financial data from web pages, retrieve historical stock data using yfinance, and visualize trends with matplotlib. Also, the tutorial demonstrates how to integrate an interactive UI using ipywidgets, culminating in a dynamic PDF report generated with FPDF.!pip install fpdf beautifulsoup4 yfinance ipywidgetsFirst, we install the necessary libraries for our project: fpdf for generating PDF reports, beautifulsoup4 for web scraping, yfinance for retrieving historical financial data, and ipywidgets for creating interactive UI elements in the notebook.import requestsfrom bs4 import BeautifulSoupfrom fpdf import FPDFimport yfinance as yfimport matplotlib.pyplot as pltimport ipywidgets as widgetsfrom IPython.display import display, FileLinkHere, we import a range of libraries to build a comprehensive financial data tool.def generate_report(b): symbol = symbol_text.value.upper().strip() start_date = start_date_picker.value end_date = end_date_picker.value output_area.clear_output() # Clear previous outputs if not (symbol and start_date and end_date): with output_area: print("Please provide valid inputs for stock symbol and both dates.") return with output_area: print(f"Generating report for {symbol} from {start_date} to {end_date}...") # 1. Retrieve current price using yfinance try: stock = yf.Ticker(symbol) current_price = stock.info.get('regularMarketPrice', 'N/A') except Exception as e: current_price = "Error retrieving price" with output_area: print("Error retrieving current price:", e) # 2. Fetch historical data using yfinance try: hist = stock.history(start=start_date, end=end_date) except Exception as e: hist = None with output_area: print("Error fetching historical data:", e) # 3. Plot historical closing prices if hist is not None and not hist.empty: plt.figure(figsize=(10, 5)) plt.plot(hist.index, hist['Close'], marker='o', linestyle='-', label="Close Price") plt.title(f"{symbol} Historical Closing Prices") plt.xlabel("Date") plt.ylabel("Close Price (USD)") plt.grid(True) plt.xticks(rotation=45) plt.tight_layout() graph_filename = "graph.png" plt.savefig(graph_filename) plt.show() else: graph_filename = None with output_area: print("No historical data available for the selected date range.") # 4. Create a PDF report using FPDF pdf = FPDF() pdf.add_page() pdf.set_font("Arial", "B", 16) pdf.cell(0, 10, f"Financial Report for {symbol}", ln=True, align="C") pdf.ln(10) pdf.set_font("Arial", size=12) pdf.cell(0, 10, f"Current Price: {current_price}", ln=True) pdf.cell(0, 10, f"Date Range: {start_date} to {end_date}", ln=True) pdf.ln(10) if graph_filename: pdf.cell(0, 10, "Historical Closing Prices:", ln=True) # Adjust the image width to fit the page layout pdf.image(graph_filename, w=180) pdf_filename = "financial_report.pdf" pdf.output(pdf_filename) # 5. Display the download link for the PDF report with output_area: print(f"PDF Report generated: {pdf_filename}") display(FileLink(pdf_filename))With the above function, we retrieve user inputs for the stock symbol and date range, then scrape the current financial data from Yahoo Finance while fetching historical data via yfinance. It plots the historical closing prices using matplotlib, generates a PDF report embedding the scraped data and the graph using FPDF, and finally displays a download link for the PDF report.# Create UI widgetssymbol_text = widgets.Text( value="AAPL", description="Stock Symbol:", placeholder="e.g., AAPL")start_date_picker = widgets.DatePicker( description='Start Date')end_date_picker = widgets.DatePicker( description='End Date')generate_button = widgets.Button( description="Generate Report", button_style='success')output_area = widgets.Output()generate_button.on_click(generate_report)display(widgets.VBox([symbol_text, start_date_picker, end_date_picker, generate_button, output_area]))Finally, this code block sets up an interactive user interface using ipywidgets. It creates input fields for a stock symbol, date pickers for a start and end date, and a button to trigger the report generation. The UI elements are then organized vertically using a VBox layout, and an output area is provided to display feedback and the generated PDF download link.Output and PDF SampleIn conclusion, by following this tutorial, you have successfully integrated web scraping, data analysis, interactive UI design, and PDF report generation into a single Google Colab notebook. This step-by-step process illustrates how to harness the power of Pythons diverse libraries to create a robust, user-friendly financial data tool.Here is the Colab Notebook for the above project. Also,dont forget to follow us onTwitterand join ourTelegram ChannelandLinkedIn Group. Dont Forget to join our80k+ ML SubReddit. Asif RazzaqWebsite| + postsBioAsif Razzaq is the CEO of Marktechpost Media Inc.. As a visionary entrepreneur and engineer, Asif is committed to harnessing the potential of Artificial Intelligence for social good. His most recent endeavor is the launch of an Artificial Intelligence Media Platform, Marktechpost, which stands out for its in-depth coverage of machine learning and deep learning news that is both technically sound and easily understandable by a wide audience. The platform boasts of over 2 million monthly views, illustrating its popularity among audiences.Asif Razzaqhttps://www.marktechpost.com/author/6flvq/DeepSeek AI Releases DeepEP: An Open-Source EP Communication Library for MoE Model Training and InferenceAsif Razzaqhttps://www.marktechpost.com/author/6flvq/Building an Interactive Weather Data Scraper in Google Colab: A Code Guide to Extract, Display, and Download Live Forecast Data Using Python, BeautifulSoup, Requests, Pandas, and IpywidgetsAsif Razzaqhttps://www.marktechpost.com/author/6flvq/Building a Legal AI Chatbot: A Step-by-Step Guide Using bigscience/T0pp LLM, Open-Source NLP Models, Streamlit, PyTorch, and Hugging Face TransformersAsif Razzaqhttps://www.marktechpost.com/author/6flvq/Moonshot AI and UCLA Researchers ReleaseMoonlight: A 3B/16B-Parameter Mixture-of-Expert (MoE) Model Trained with 5.7T Tokens Using Muon Optimizer Recommended Open-Source AI Platform: IntellAgent is a An Open-Source Multi-Agent Framework to Evaluate Complex Conversational AI System' (Promoted)
0 التعليقات
·0 المشاركات
·62 مشاهدة