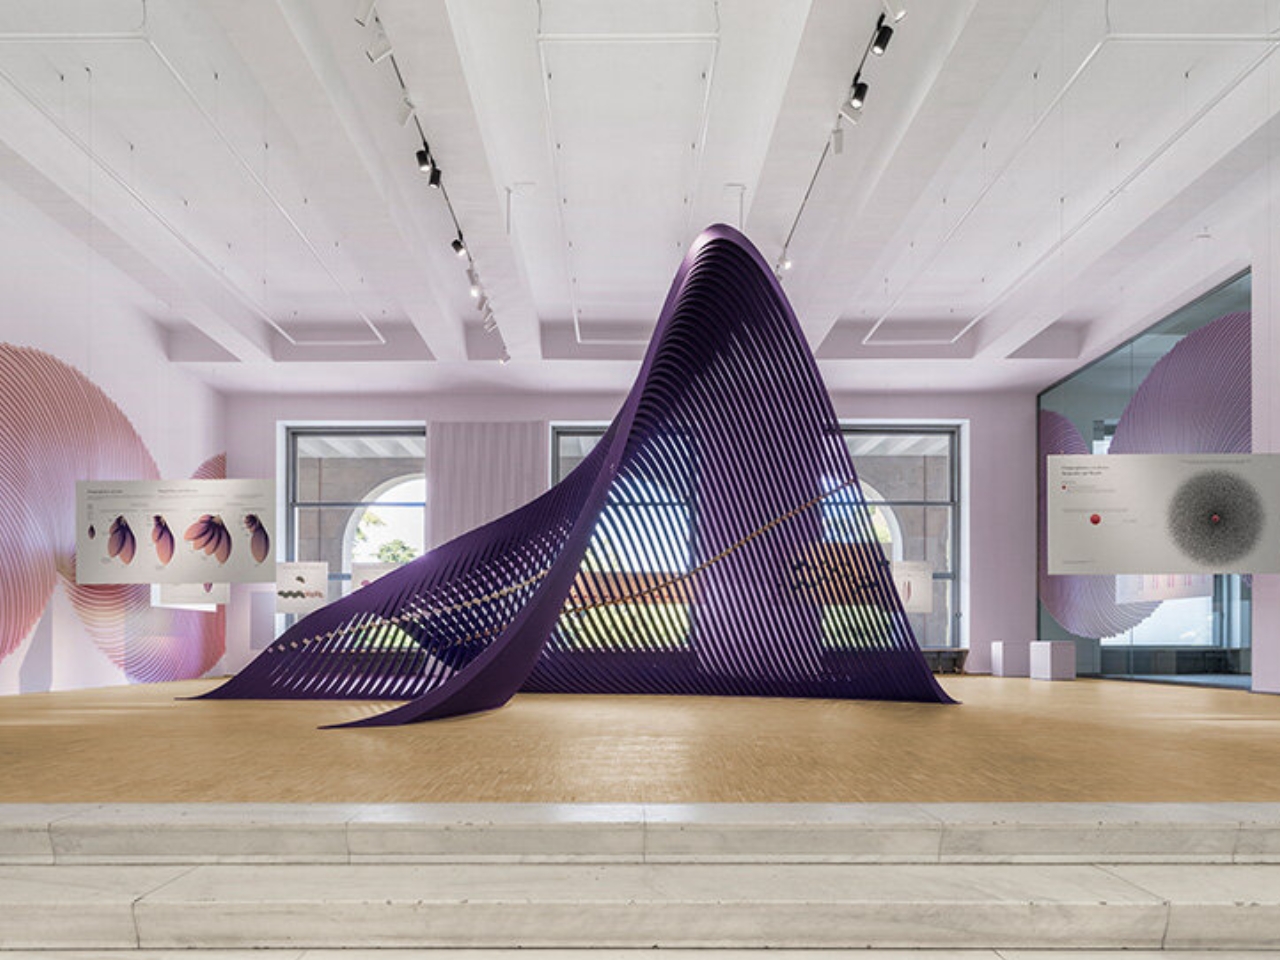
Imagine stepping into an art installation where economic and environmental data transforms into tangible objects that you can see and touch. This innovative approach breathes life into the often abstract world of numbers and charts, making complex information accessible and relatable. As a TouchDesigner Interactive Designer, I find it fascinating how art can bridge the gap between data and human experience. By turning statistics into physical forms, we’re invited to engage with important issues on a sensory level, sparking deeper understanding and reflection. This intersection of creativity and data not only enhances our appreciation of the world around us but also empowers us to think critically about the information that shapes our lives. It's a reminder that creativity and analytical thinking can coexist beautifully, driving meaningful conversations about our economy and environment. What are your thoughts on this dynamic fusion?
Imagine stepping into an art installation where economic and environmental data transforms into tangible objects that you can see and touch. This innovative approach breathes life into the often abstract world of numbers and charts, making complex information accessible and relatable. As a TouchDesigner Interactive Designer, I find it fascinating how art can bridge the gap between data and human experience. By turning statistics into physical forms, we’re invited to engage with important issues on a sensory level, sparking deeper understanding and reflection. This intersection of creativity and data not only enhances our appreciation of the world around us but also empowers us to think critically about the information that shapes our lives. It's a reminder that creativity and analytical thinking can coexist beautifully, driving meaningful conversations about our economy and environment. What are your thoughts on this dynamic fusion?


