
Housing market shift explained—and where it’s happening the fastest
Want more housing market stories from Lance Lambert’s ResiClub in your inbox? Subscribe to the ResiClub newsletter.
During the Pandemic Housing Boom, housing demand surged rapidly amid ultralow interest rates, stimulus, and the remote work boom—which increased demand for space and unlocked “WFH arbitrage” as high earners were able to keep their income from a job in say, NYC or L.A., and buy in say Austin or Tampa. Federal Reserve researchers estimate “new construction would have had to increase by roughly 300% to absorb the pandemic-era surge in demand.” Unlike housing demand, housing stock supply isn’t as elastic and can’t ramp up as quickly. As a result, the heightened pandemic era demand drained the market of active inventory and overheated home prices, with U.S. home prices rising a staggering 43.2% between March 2020 and June 2022.
While many commentators view active inventory and months of supply simply as measures of “supply,” ResiClub sees them more as proxies for the supply-demand equilibrium. Because housing demand is more elastic than housing stock, large swings in active inventory or months of supply are usually driven by shifts in demand. For example, during the Pandemic Housing Boom, surging demand caused homes to sell faster—pushing active inventory down, even as new listings remained steady. Conversely, in recent years, weakening demand has led to slower sales, causing active inventory to rise—even as new listings fell below trend.
Indeed, during the ravenous housing demand at the height of the Pandemic Housing Boom in April 2022, almost the entire country was at least -50% below pre-pandemic 2019 active inventory levels.
BROWN = Active housing inventory for sale in April 2022 was BELOW pre-pandemic 2019 levels
GREEN = Active housing inventory for sale in April 2022 was ABOVE pre-pandemic 2019 levels
Of course, now it’s a different picture: National active inventory is on a multiyear rise.
Not long after mortgage rates spiked in 2022—causing affordability to reflect the reality of the sharp home price increases during the Pandemic Housing Boom—and return-to-office gained a bit of momentum, national demand in the for-sale market pulled back and the Pandemic Housing Boom fizzled out. Initially, in the second half of 2022, that housing demand pullback triggered a “fever breaking” in a number of markets—particularly in rate-sensitive West Coast housing markets and in pandemic boomtowns like Austin and Boise—causing active inventory to spike and pushing those markets into correction-mode in the second half of 2022.
Heading into 2023, many of those same Western and pandemic boomtown marketsstabilized, as the spring seasonal demand—coupled with still-tight active inventory levels—was enough to temporarily firm up the market. For a bit, national active inventory stopped rising year-over-year.
However, that period of national inventory stabilization didn’t last. Amid still slumped housing demand, national active inventory began to rise again—and we’re now in the midst of an 18-month streak of year-over-year increases in national active listings.
Where active inventory/months of supply has risen the most, homebuyers have gained the most leverage. Generally speaking, housing markets where inventoryhas returned to pre-pandemic 2019 levels have experienced weaker home price growthover the past 34 months. Conversely, housing markets where inventory remains far below pre-pandemic 2019 levels have, generally speaking, experienced stronger home price growth over the past 34 months.
BROWN = Active housing inventory for sale in April 2025 was BELOW pre-pandemic 2019 levels
GREEN = Active housing inventory for sale in April 2025 was ABOVE pre-pandemic 2019 levels
As ResiClub has closely documented, that picture varies significantly across the country: much of the Northeast and Midwest remain below pre-pandemic 2019 inventory levels, while many parts of the Mountain West and Gulf regions have bounced back.
Many of the softest housing markets, where homebuyers have gained leverage, are located in Gulf Coast and Mountain West regions. These areas were among the nation’s top pandemic boomtowns, having experienced significant home price growth during the Pandemic Housing Boom, which stretched housing fundamentals far beyond local income levels. When pandemic-fueled domestic migration slowed and mortgage rates spiked, markets like Cape Coral, Florida, and San Antonio, Texas, faced challenges as they had to rely on local incomes to sustain frothy home prices. The housing market softening in these areas was further accelerated by higher levels of new home supply in the pipeline across the Sun Belt. Builders in these regions are often willing to reduce prices or make other affordability adjustments to maintain sales in a shifted environment. These adjustments in the new construction market also create a cooling effect on the resale market, as some buyers who might have opted for an existing home shift their focus to new homes where deals are still available.
In contrast, many Northeast and Midwest markets were less reliant on pandemic migration and have less new home construction in progress. With lower exposure to that domestic migration pullback demand shock—and fewer builders doing big affordability adjustments to move product—active inventory in these Midwest and Northeast regions has remained relatively tight—with home sellers retaining more power relative to their peers in the Gulf and Mountain West regions.
While national active inventory at the end of April 2025 was still -16% below pre-pandemic April 2019, ResiClub expects national active inventory to surpass pre-pandemic 2019 levels later this year.
Big picture: The housing market is still undergoing a process of normalization following the surge in housing demand during the Pandemic Housing Boom, when home prices went up too fast, too quickly. To date, that normalization process has pushed some markets—including Austin, Las Vegas, Phoenix, San Francisco, Boise, Punta Gorda, Cape Coral, and Tampa—into correction-mode. In some other areas, so far, it has caused home price growth to stall out. Meanwhile, some markets still remain tight and have only seen a deceleration in home price growth from the highs of the Pandemic Housing Boom.
ResiClub PRO members can access my latest monthly inventory analysishere, and my latest monthly home price analysishere.
#housing #market #shift #explainedand #where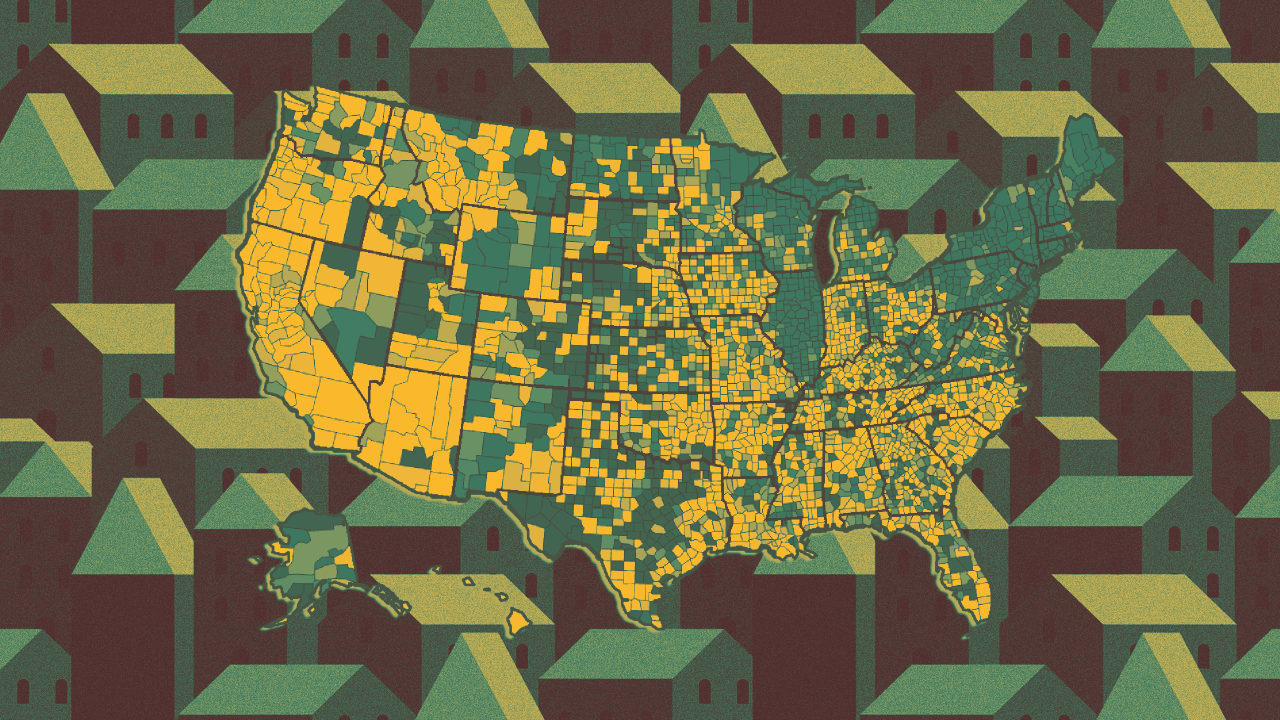
·158 Views
